TIM, September 9th 2019
From science to software:
Developing the celltrackR package for analyzing immune cell migration data
Inge Wortel
inge.wortel@radboudumc.nl
Department of Tumor Immunology, Radboudumc


Why do we make software?
Why we build and release software:
- Impact:
Make methods available to larger audience. - Reproducibility:
Make analyses completely reproducible by someone else. - Reproducibility:
Make analyses completely reproducible by someone else. - Transparancy (open source!):
Allow exact comparison between different studies/analyses.
Movement is crucial in the immune system
|
T cells in healthy LN A. Peixoto, Harvard Medical School |
Neutrophils in infected lung
Chtanova et al, Immunity 2008. |
Subtle differences, large effects!
Two of these cells just move differently by chance; the other has a different movement pattern. Can you find it?
Subtle differences, large effects!
Two of these cells just move differently by chance; the other has a different movement pattern. Can you find it?
Subtle differences, large effects!
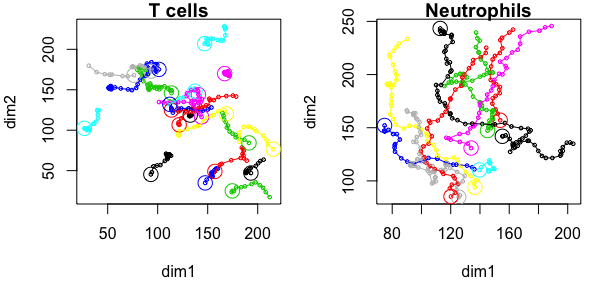
How do we quantify movement? Extracting cell "tracks"
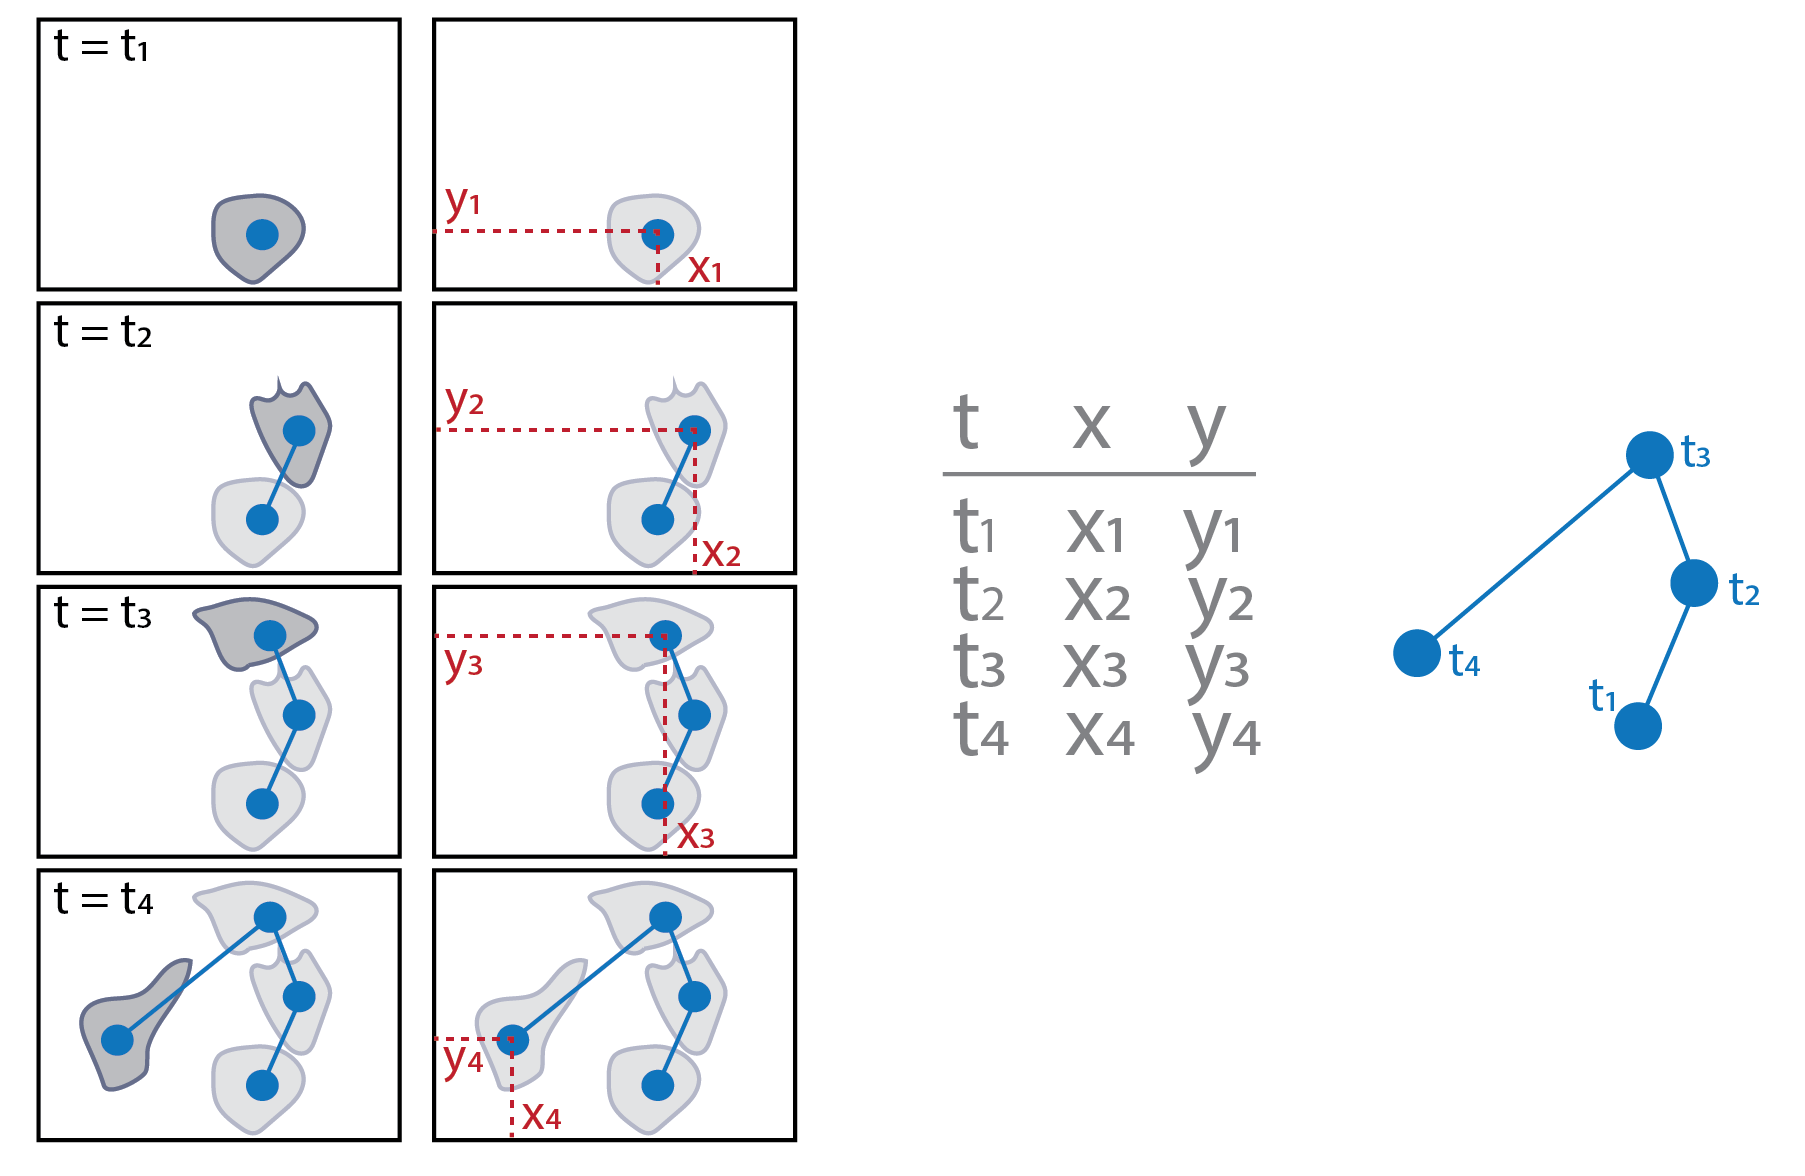
How do we quantify movement? Extracting cell "tracks"
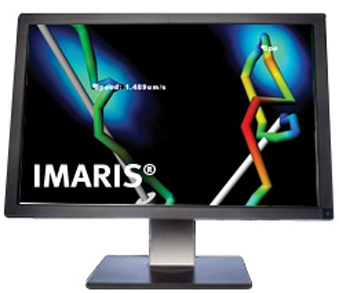
Lots of software already available:
€€€
ImarisTrack:
MetaMorph:

Volocity:

Celltracker:

Free
Icy:
Cellprofiler Tracer:

TrackMate (ImageJ):
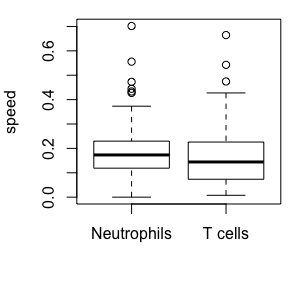
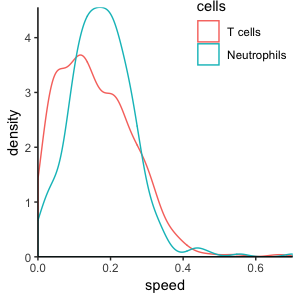
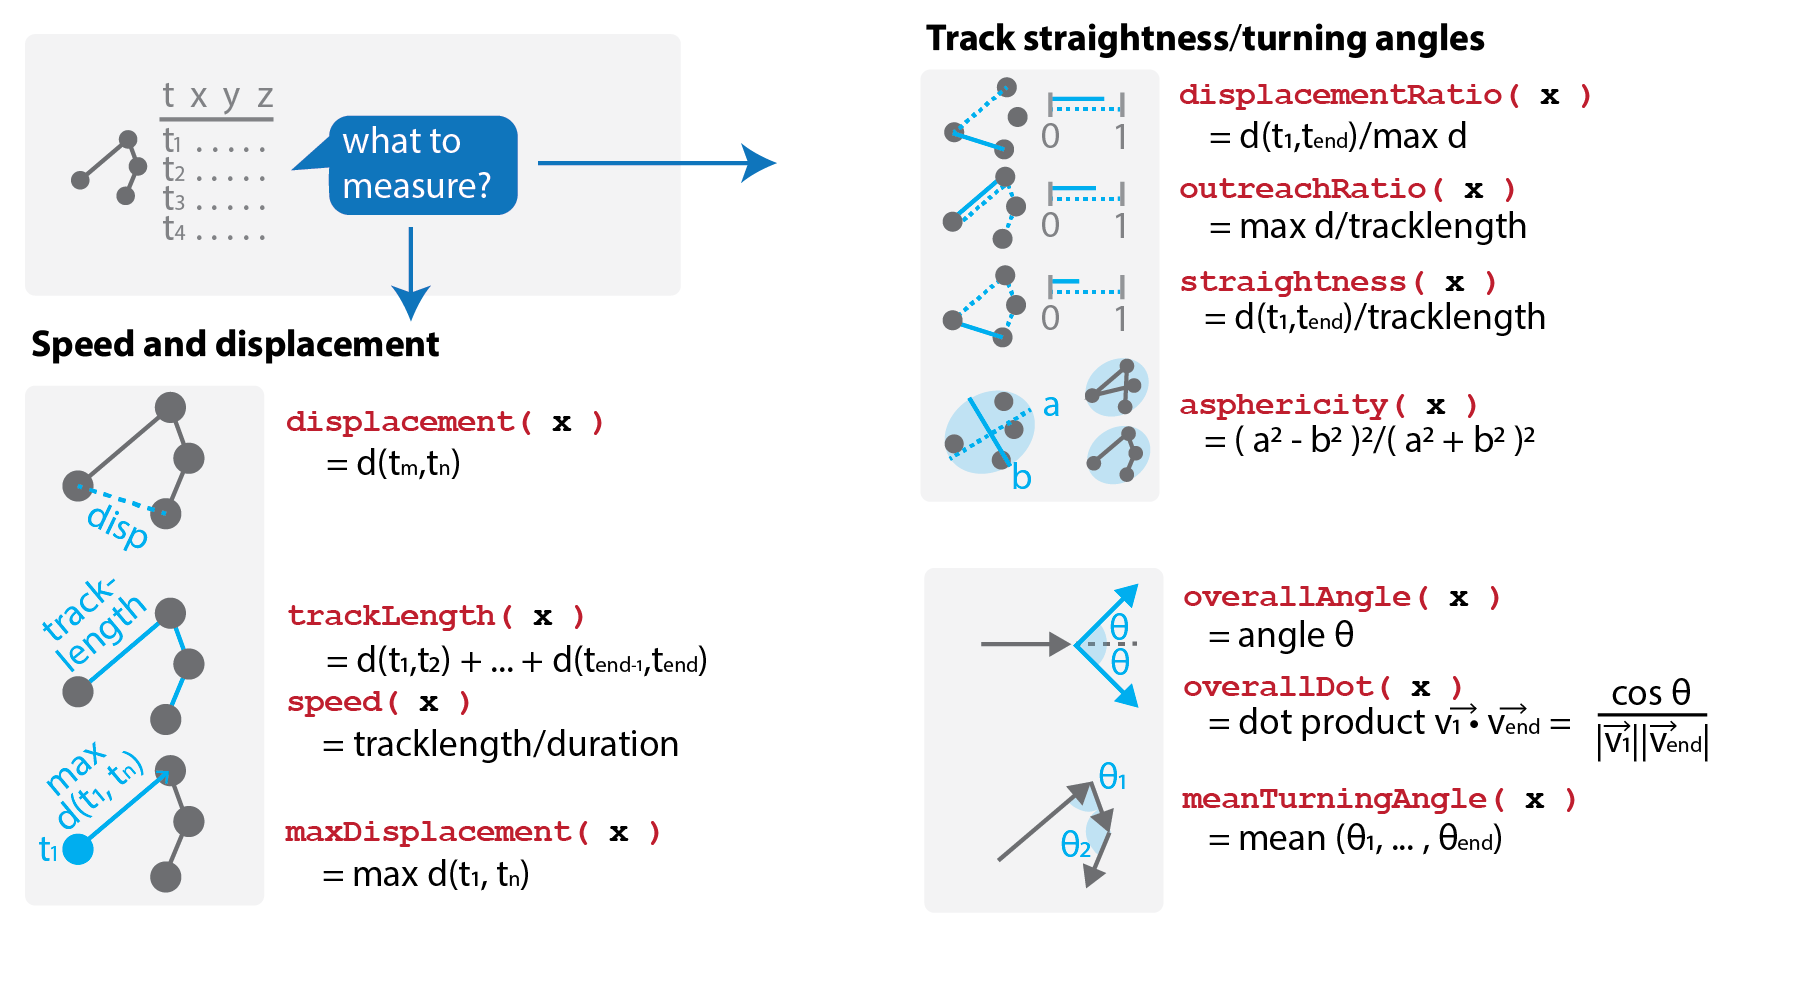
How do we quantify movement? Statistics of migration
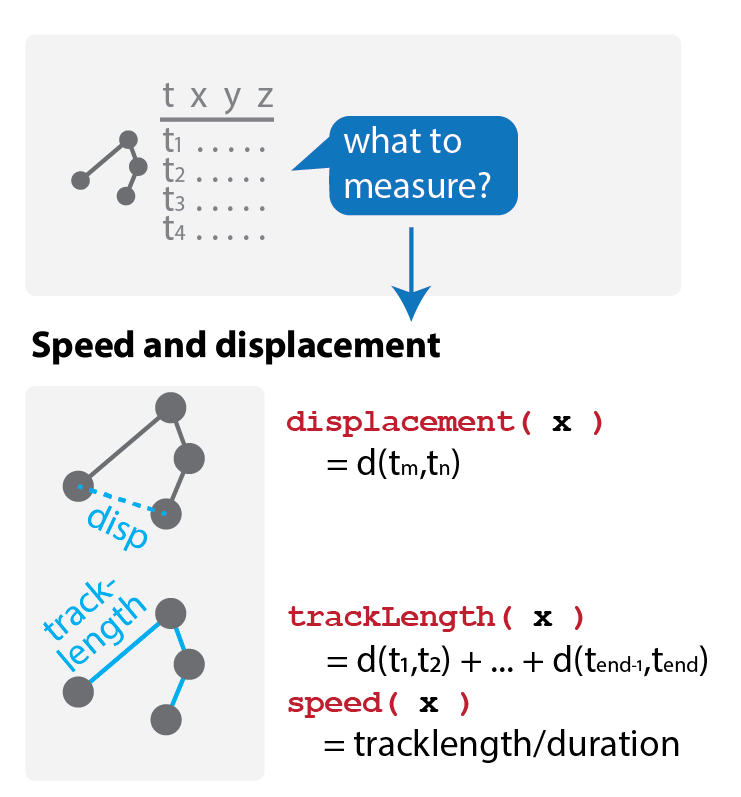
Most software quantifies tracks with some basic metrics, such as speed and displacement.
No single metric can tell the whole story:
How do we quantify movement? Statistics of migration
These cells move at the same speed, but have different directionality. We only see this when we look beyond speed:
|
|
|
The field of track analysis
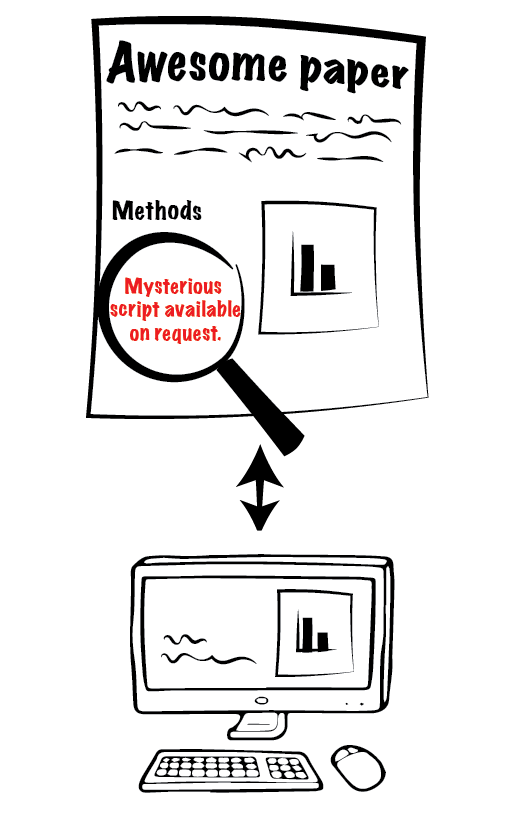
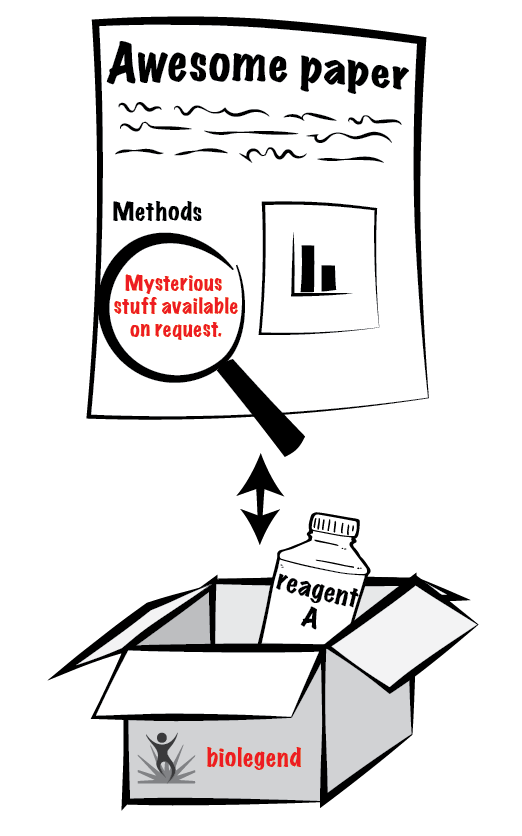
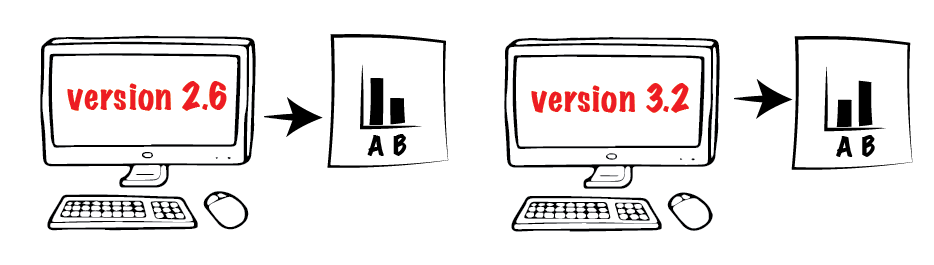
Currently, no software supports all the required analyses. Many papers with novel methods keep coming out, but they generally use custom scripts.
Aim: build software for in-depth, exploratory analysis of cell tracks.
This software must:
- Improve impact, reproducibility, and transparency of track analysis methods,
- Be complete(-ish)
- Be flexible
Step 1: Format and Audience
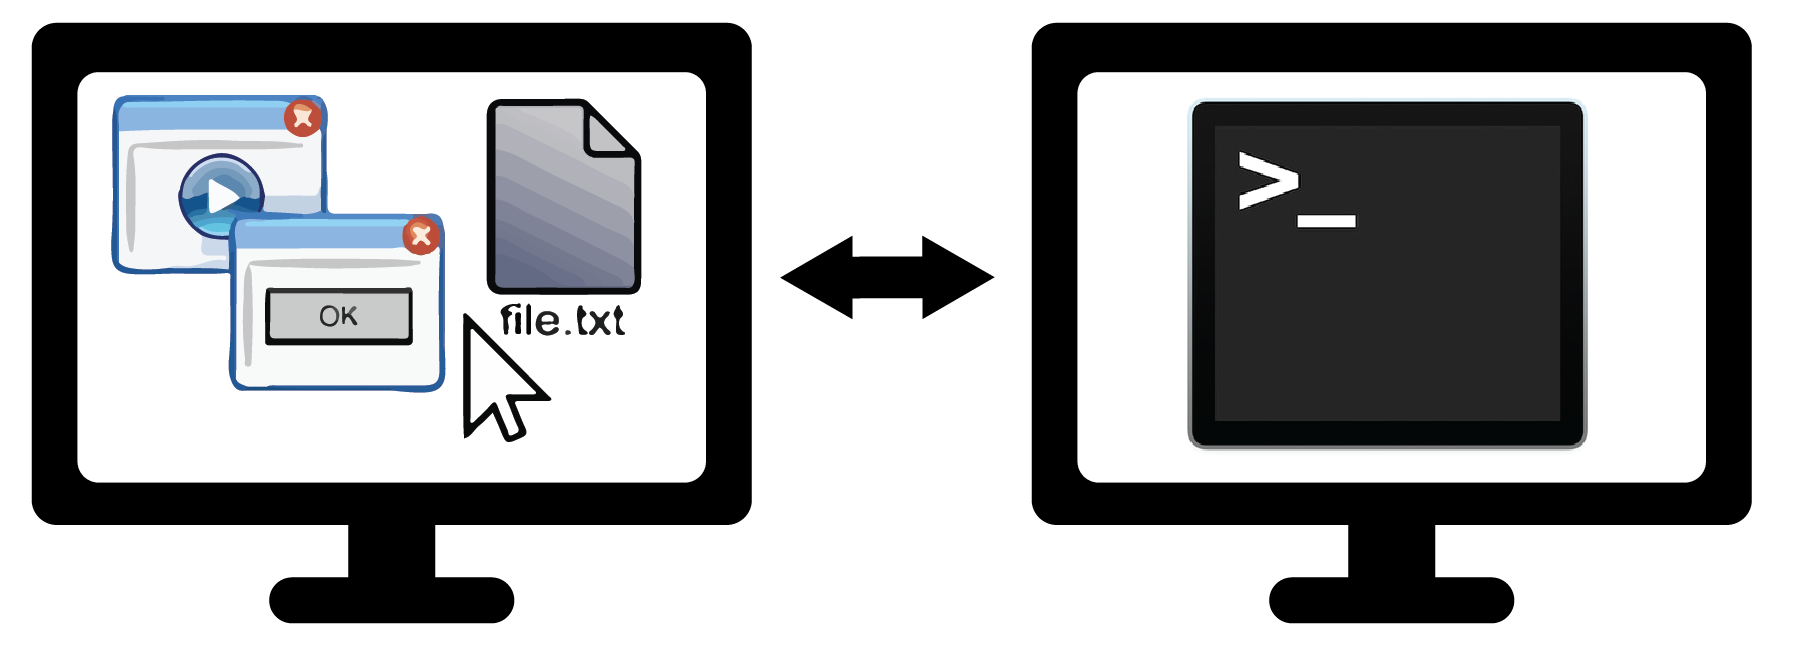
| Graphical User Interface | Code It Yourself | |||
| + | No programming required | - | Need programming skills | |
| - | Not very flexible: Only predefined methods |
+ | Very flexible: Can do anything |
|
$\rightarrow$ Format: something in between that is easy and flexible.
$\rightarrow$ Audience: biologists with some (limited) coding skills.
Step 2: Language

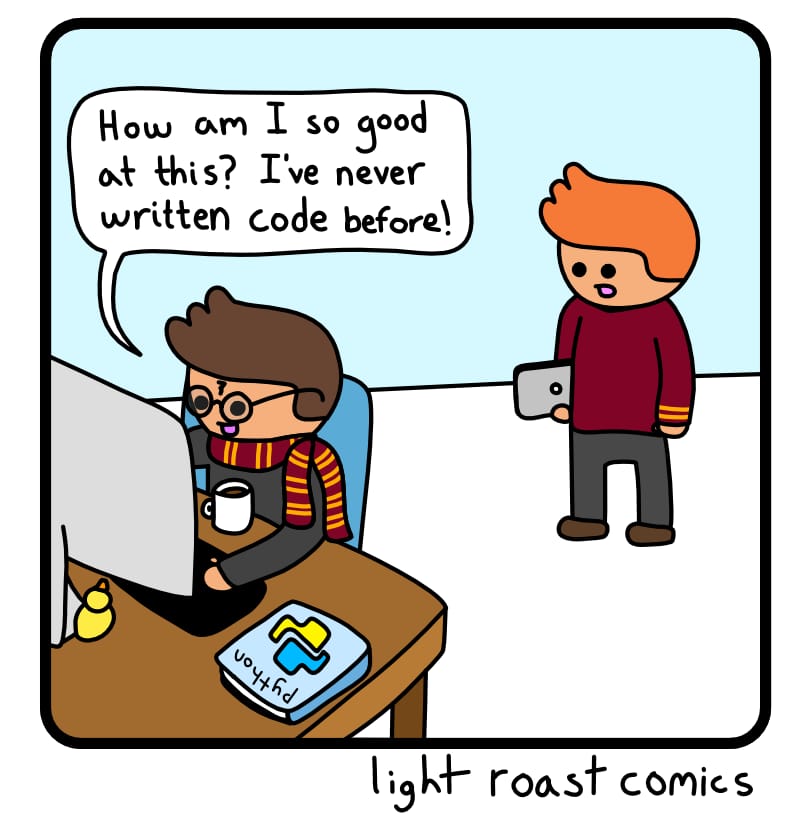


Step 2: Language
R language:
- Free and completely open-source
- Combine code, output, and text
- Popular among data scientists & bioinformaticians
- Many tools for visualization & statistical analysis
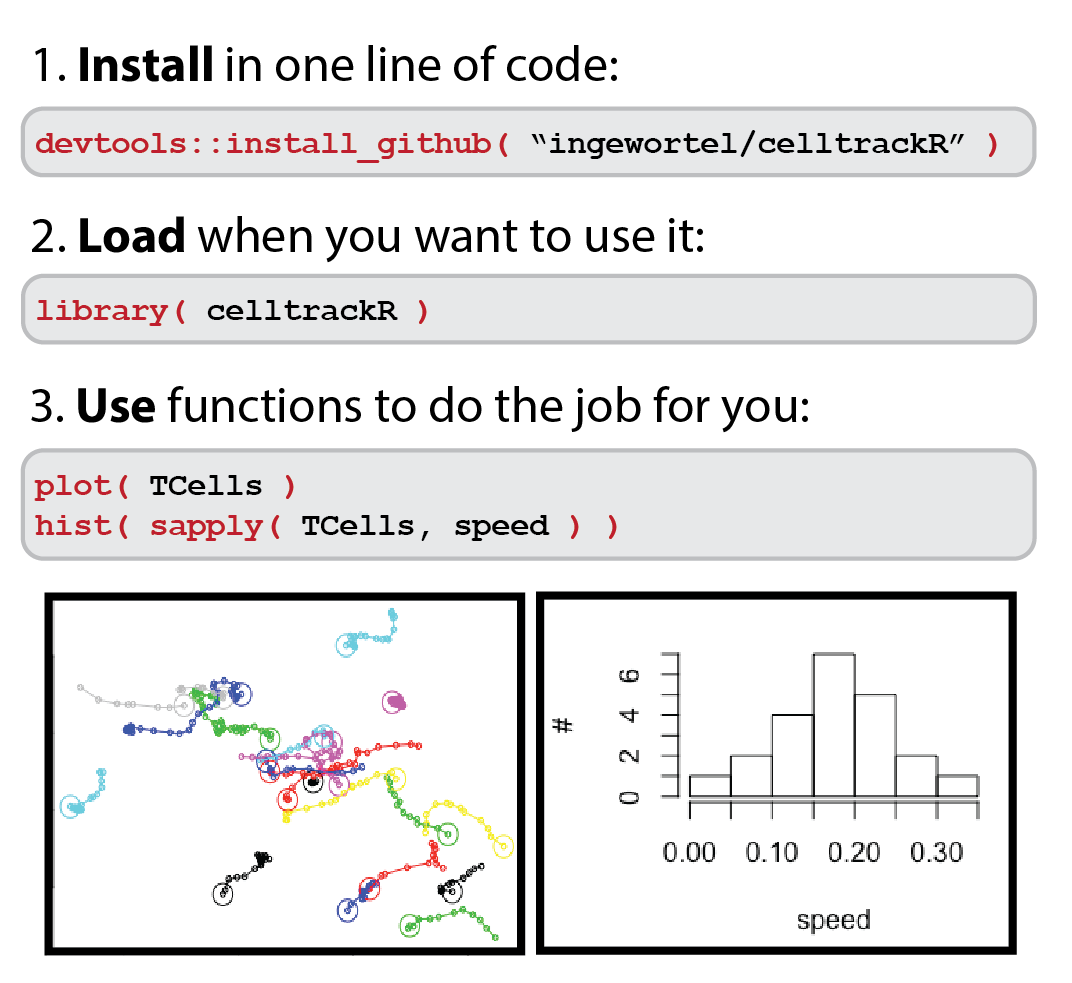
Format: an R package
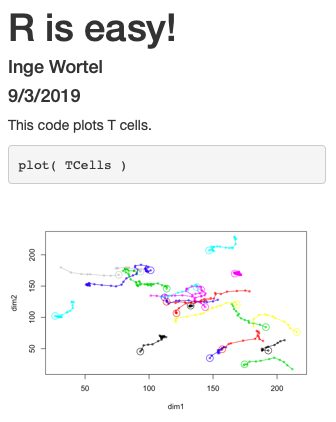
What is an R package?
An R package is a collection of functions that do things you might want to do.
Advantages:
- Easy to install
- Automatically installs any other required software
- Combine with other R packages of interest
- Works on Windows/mac/linux
Step 3: Speaking about functions... Which ones do we need?
Literature search yields a list of "metrics":
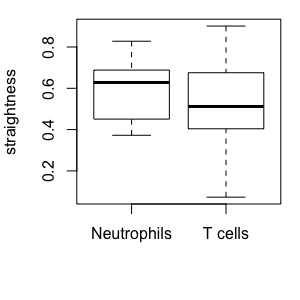
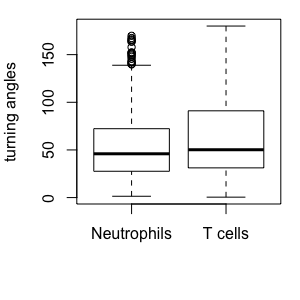
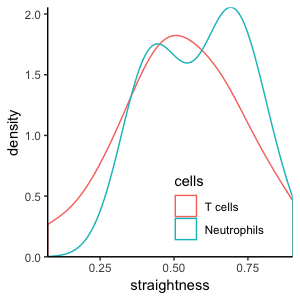
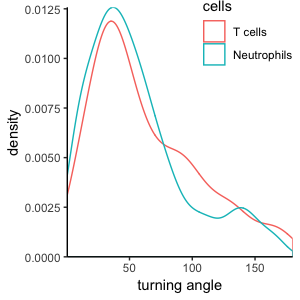
Step 3: Speaking about functions... Which ones do we need?
T cells and Neutrophils:
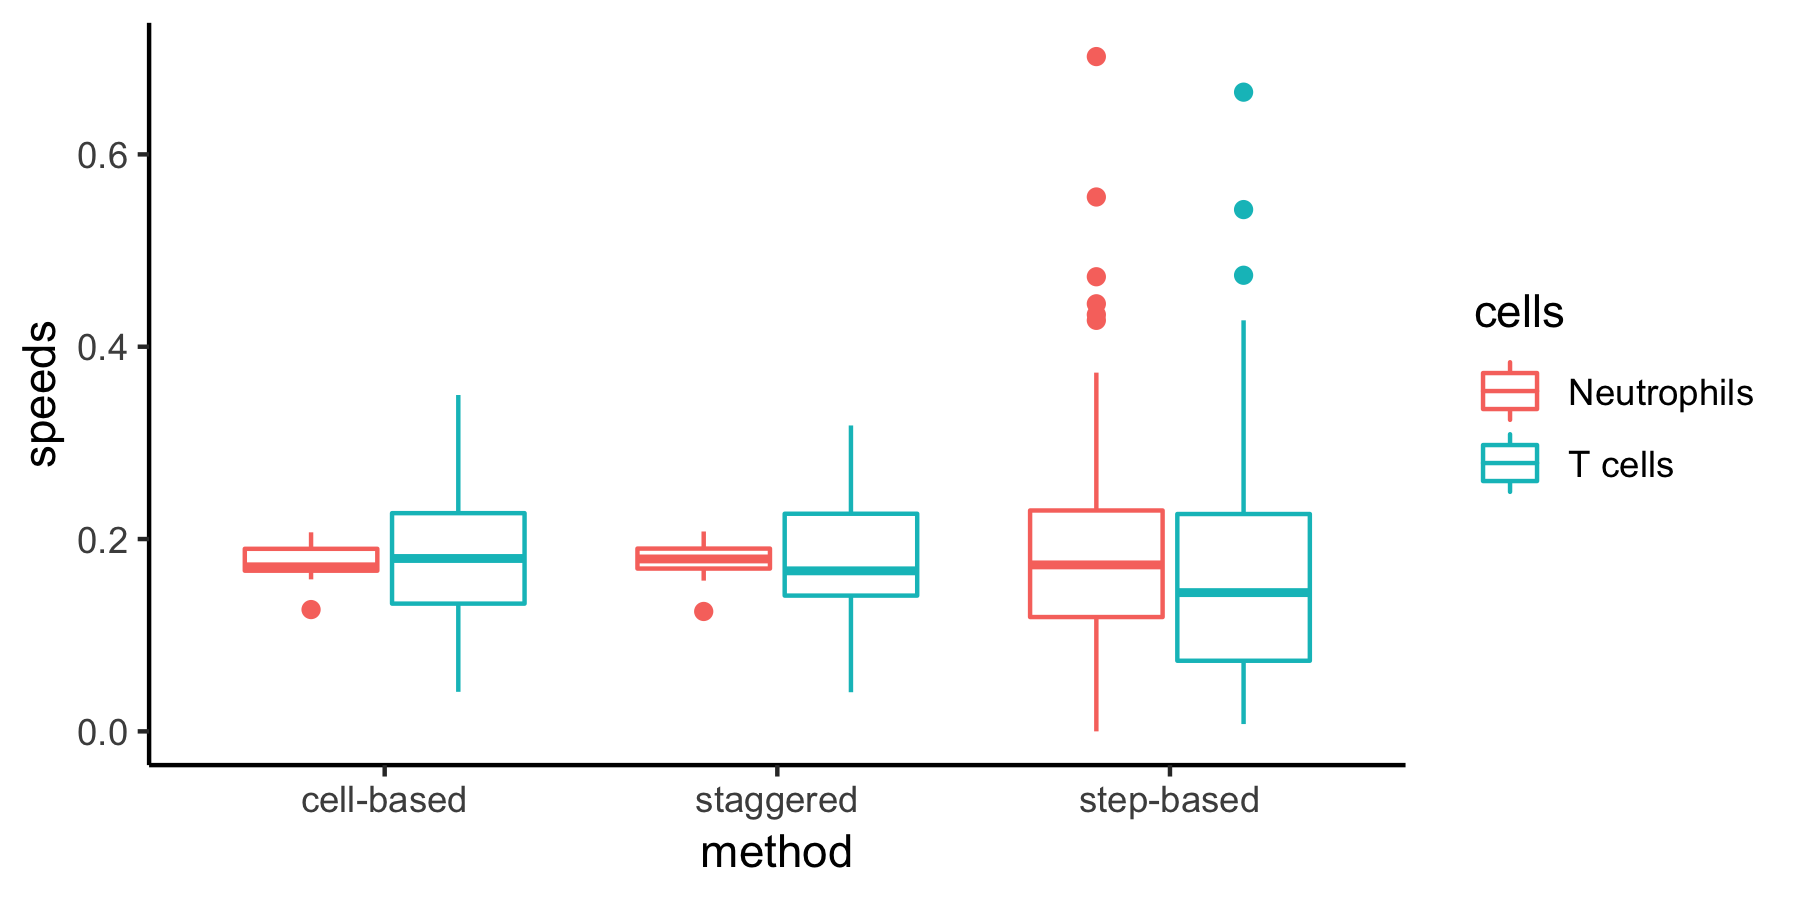
Cell-based versus step-based analyses
The same metric can be computed in different ways:
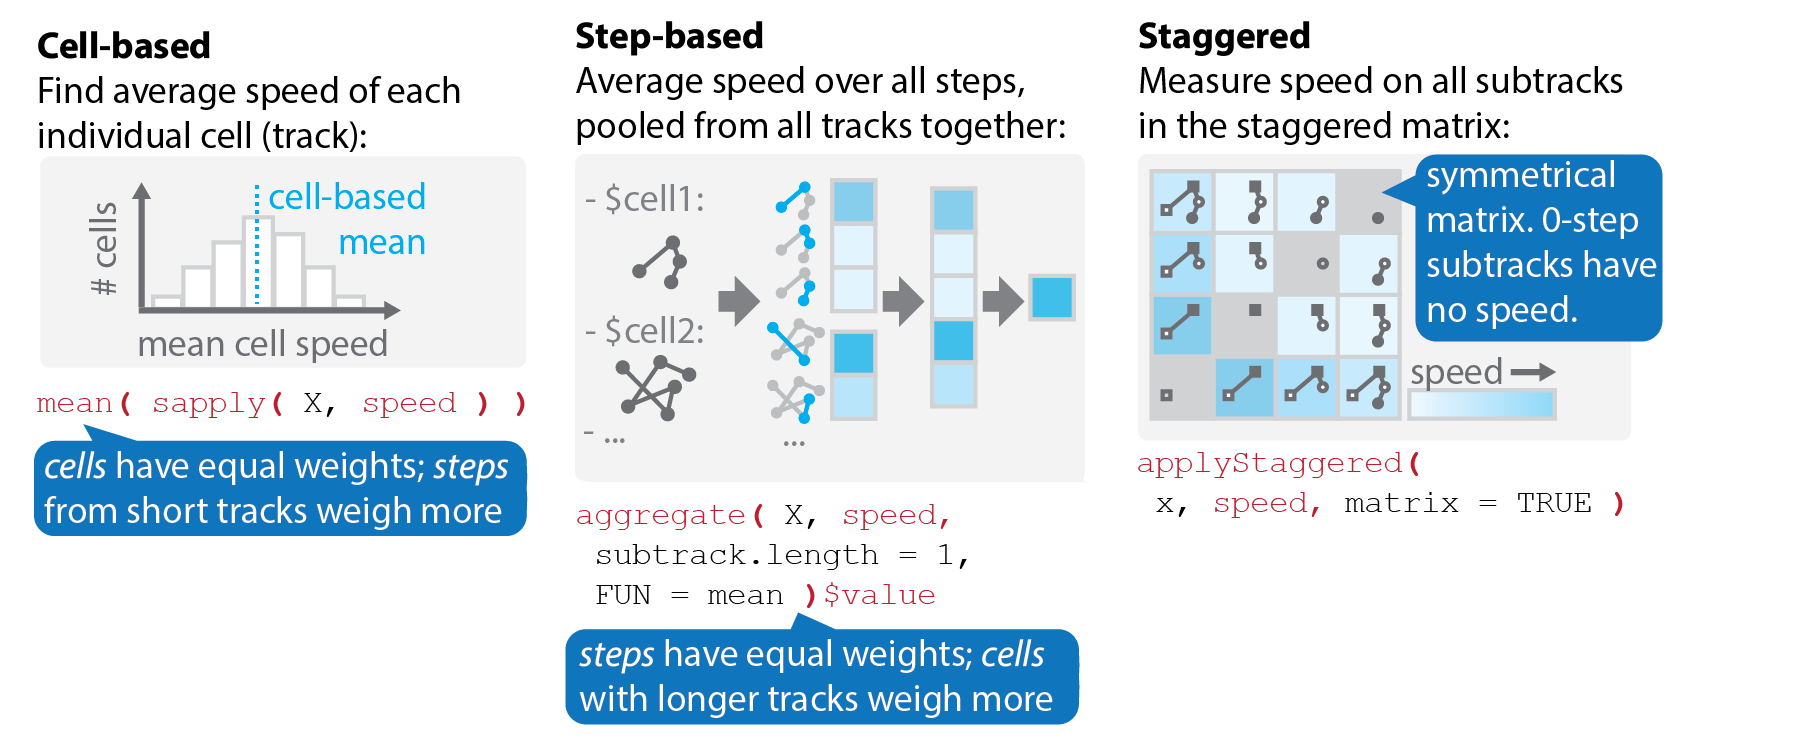
Cell-based versus step-based analyses
The same metric can be computed in different ways:
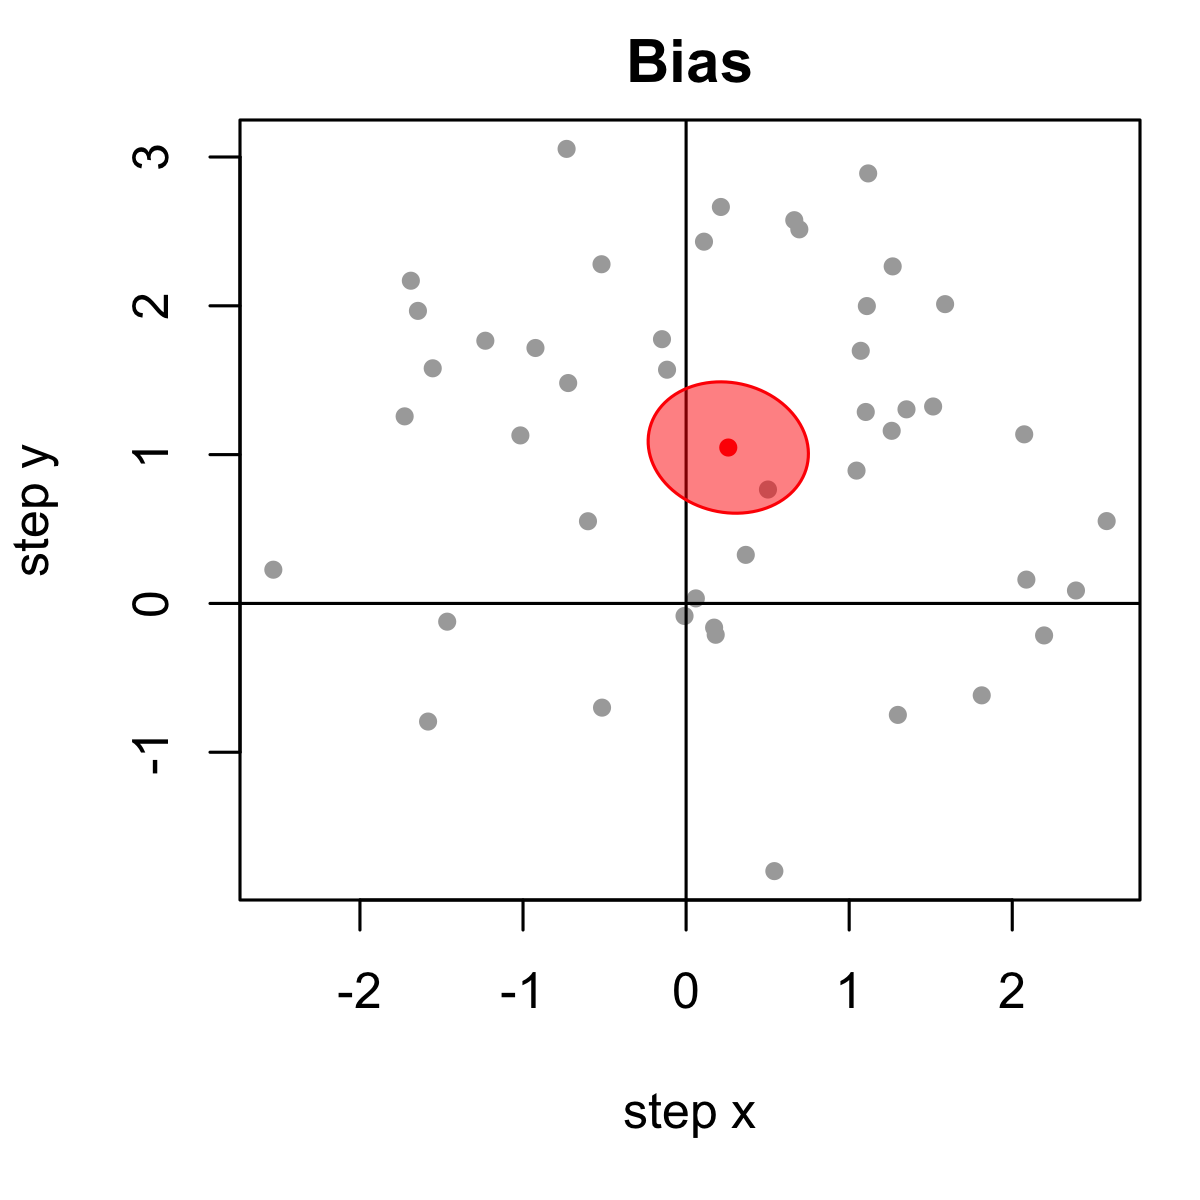
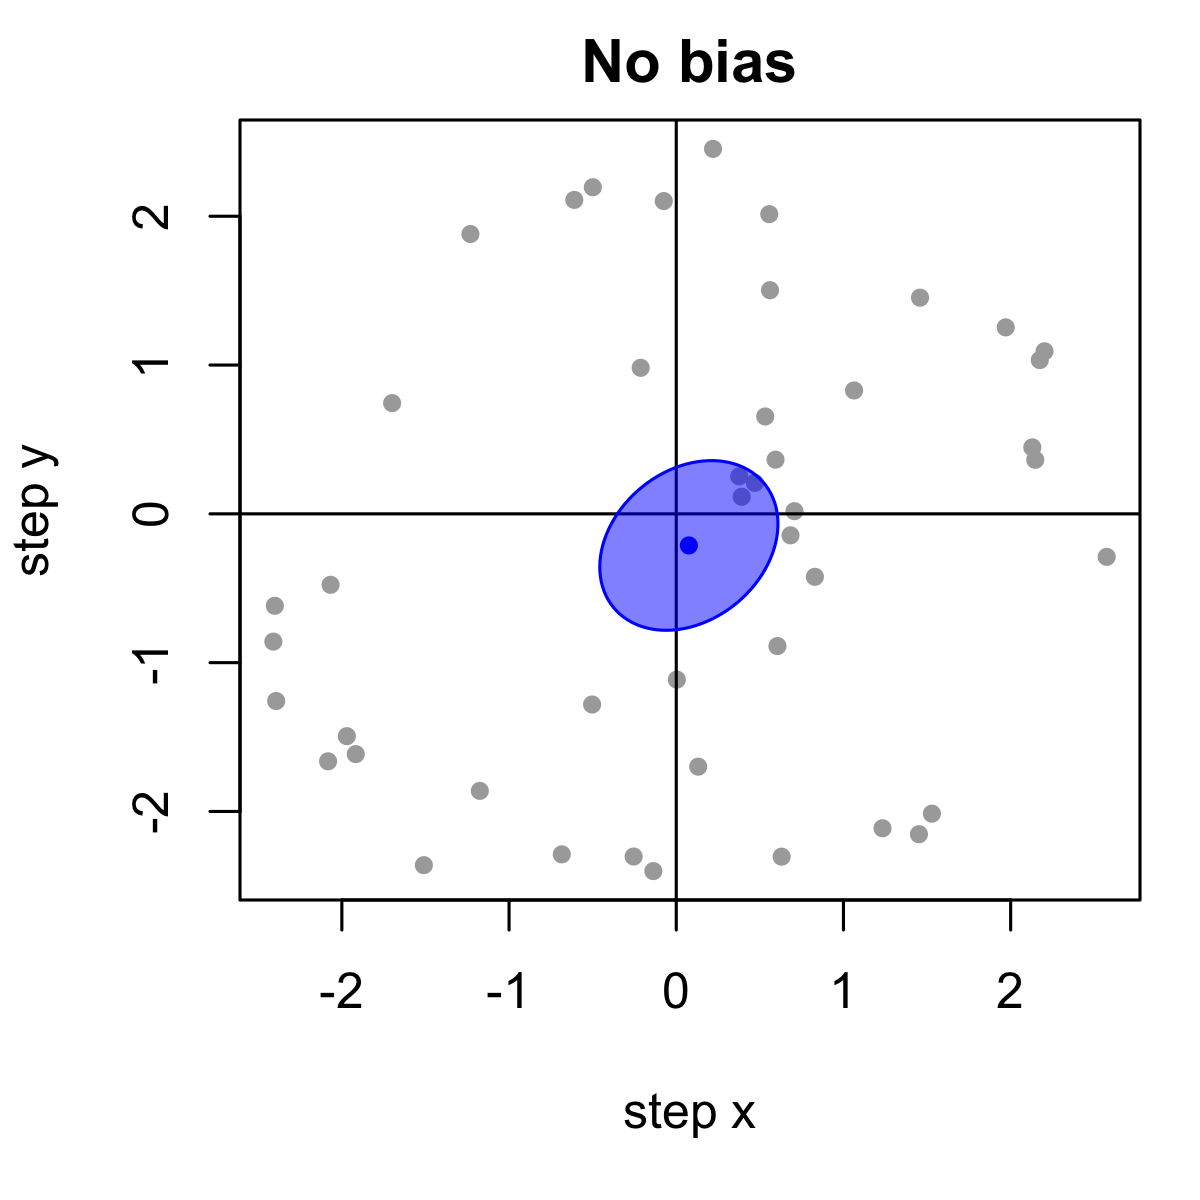
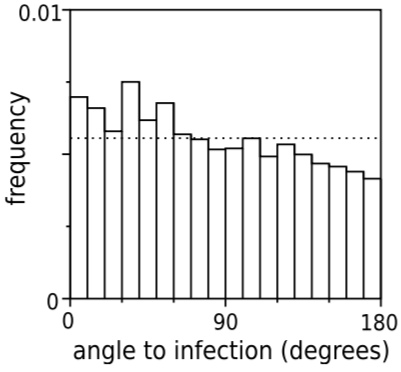
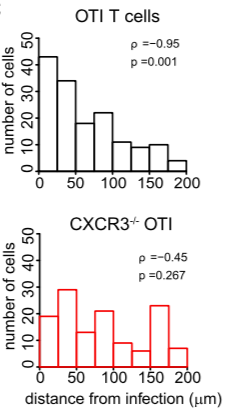
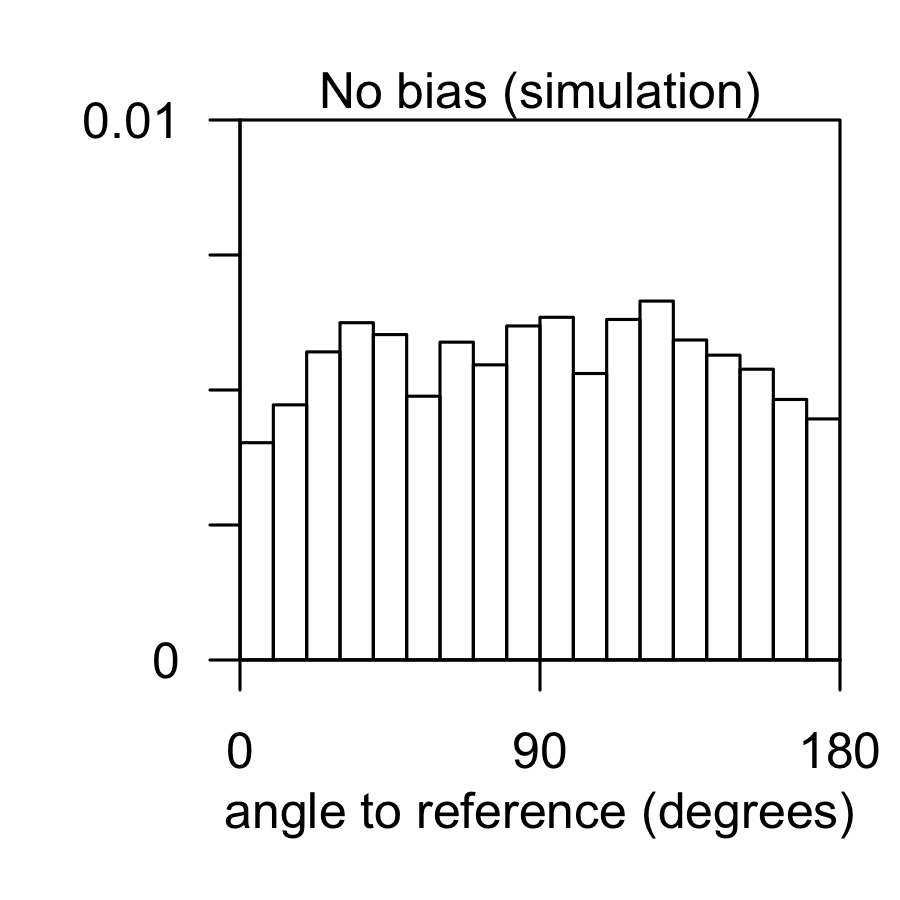
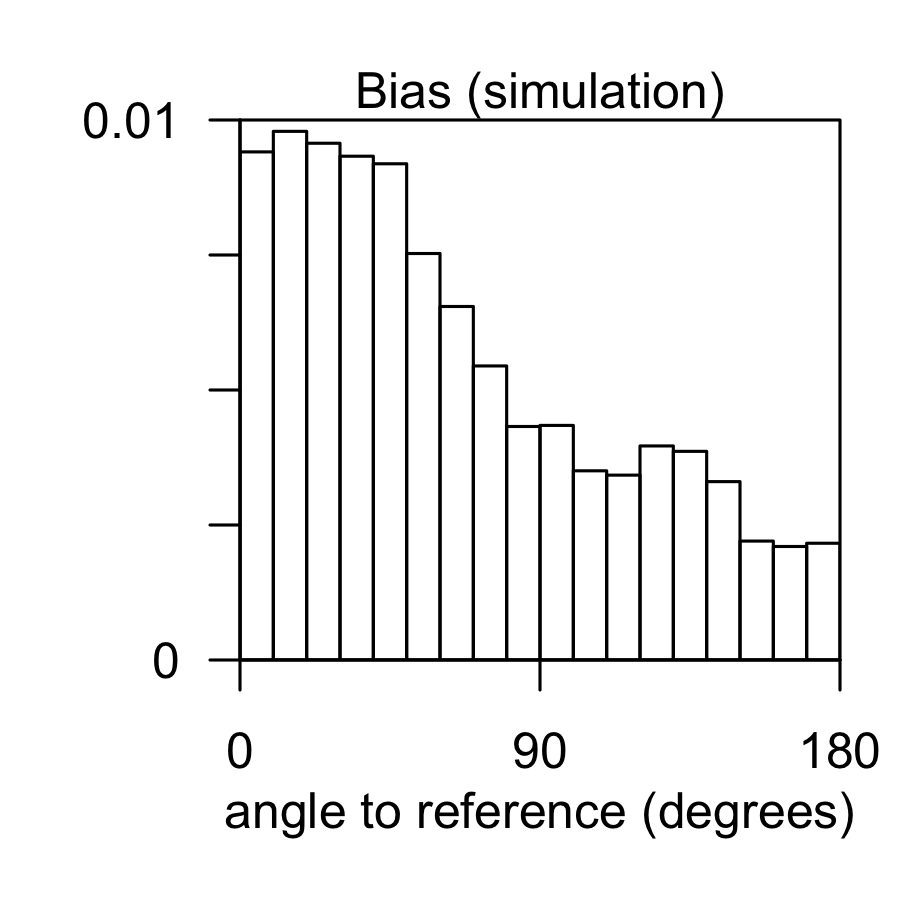
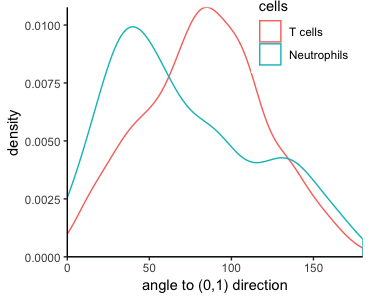
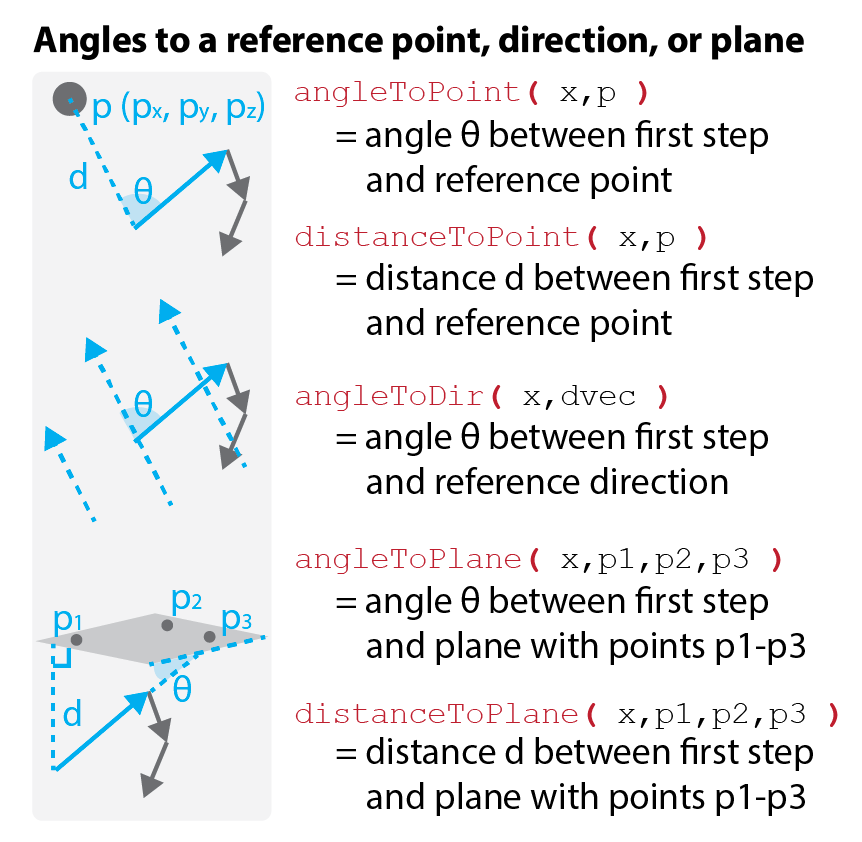
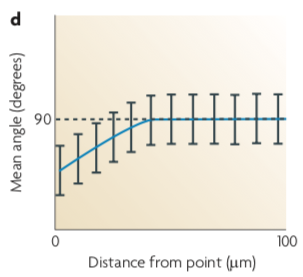
Angle analysis can help reveal chemotaxis
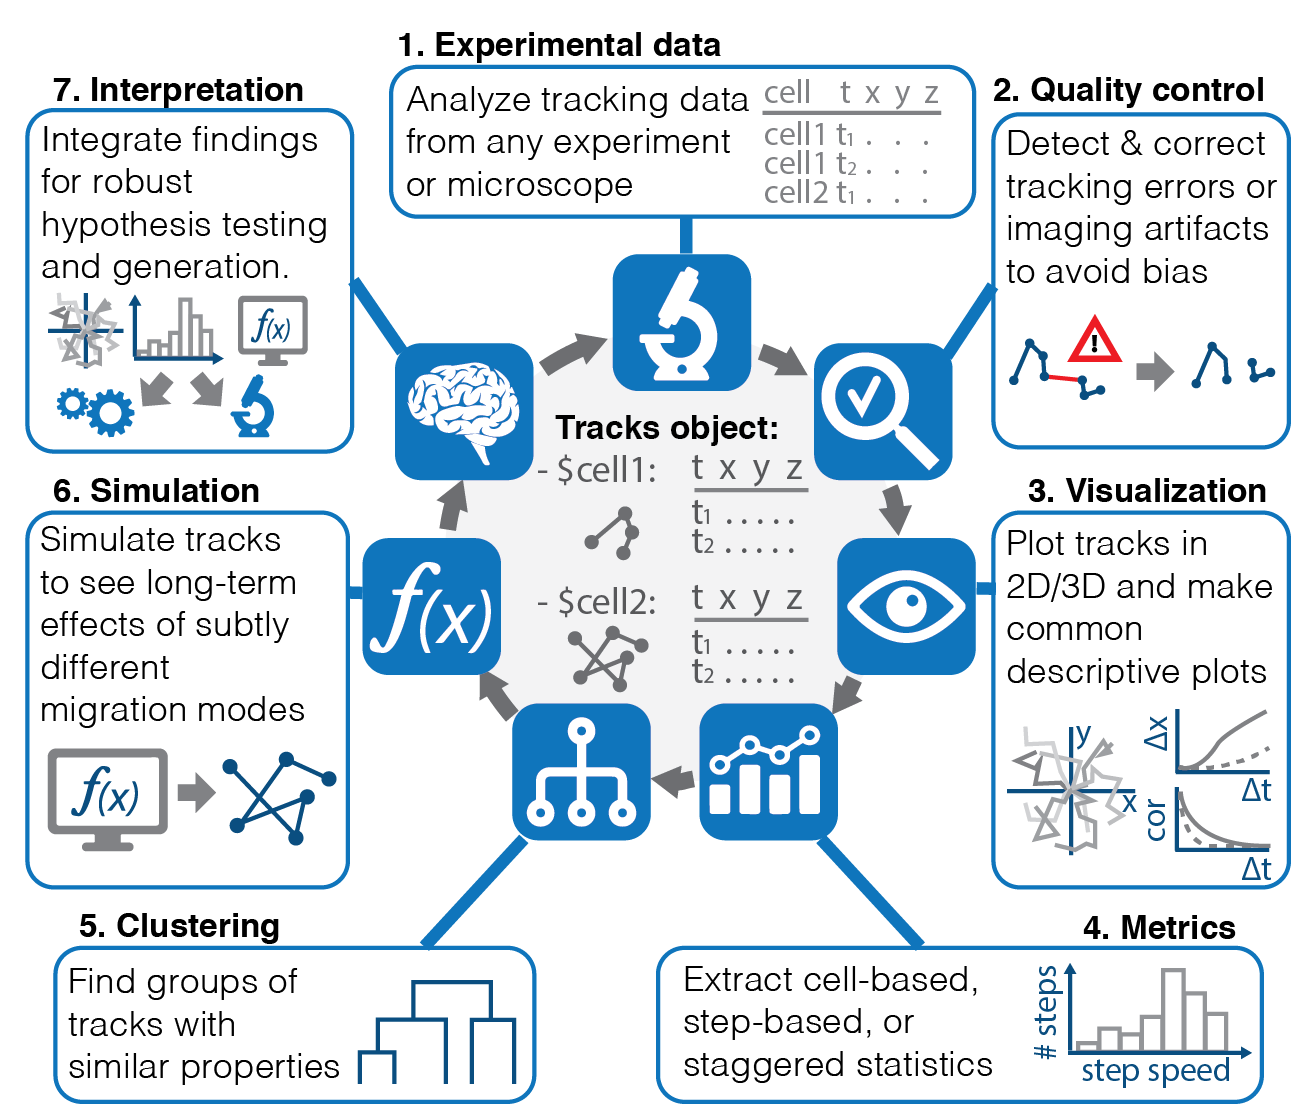
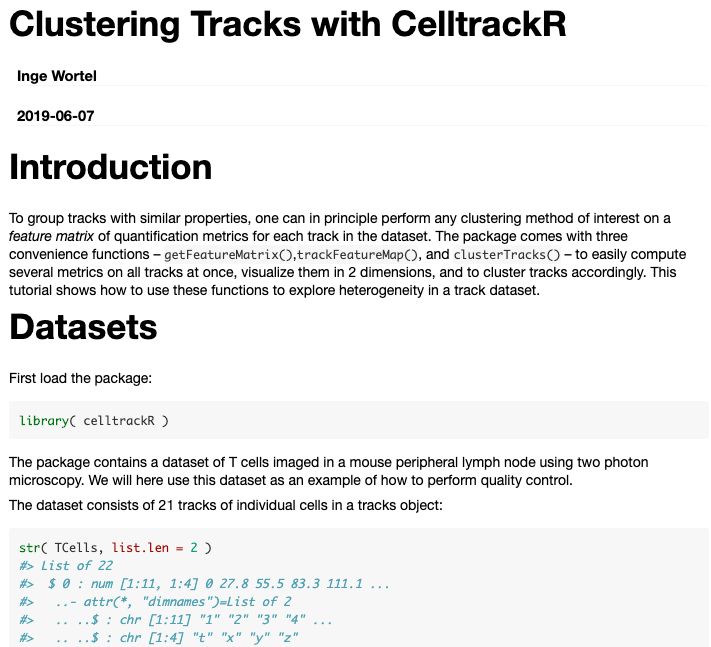
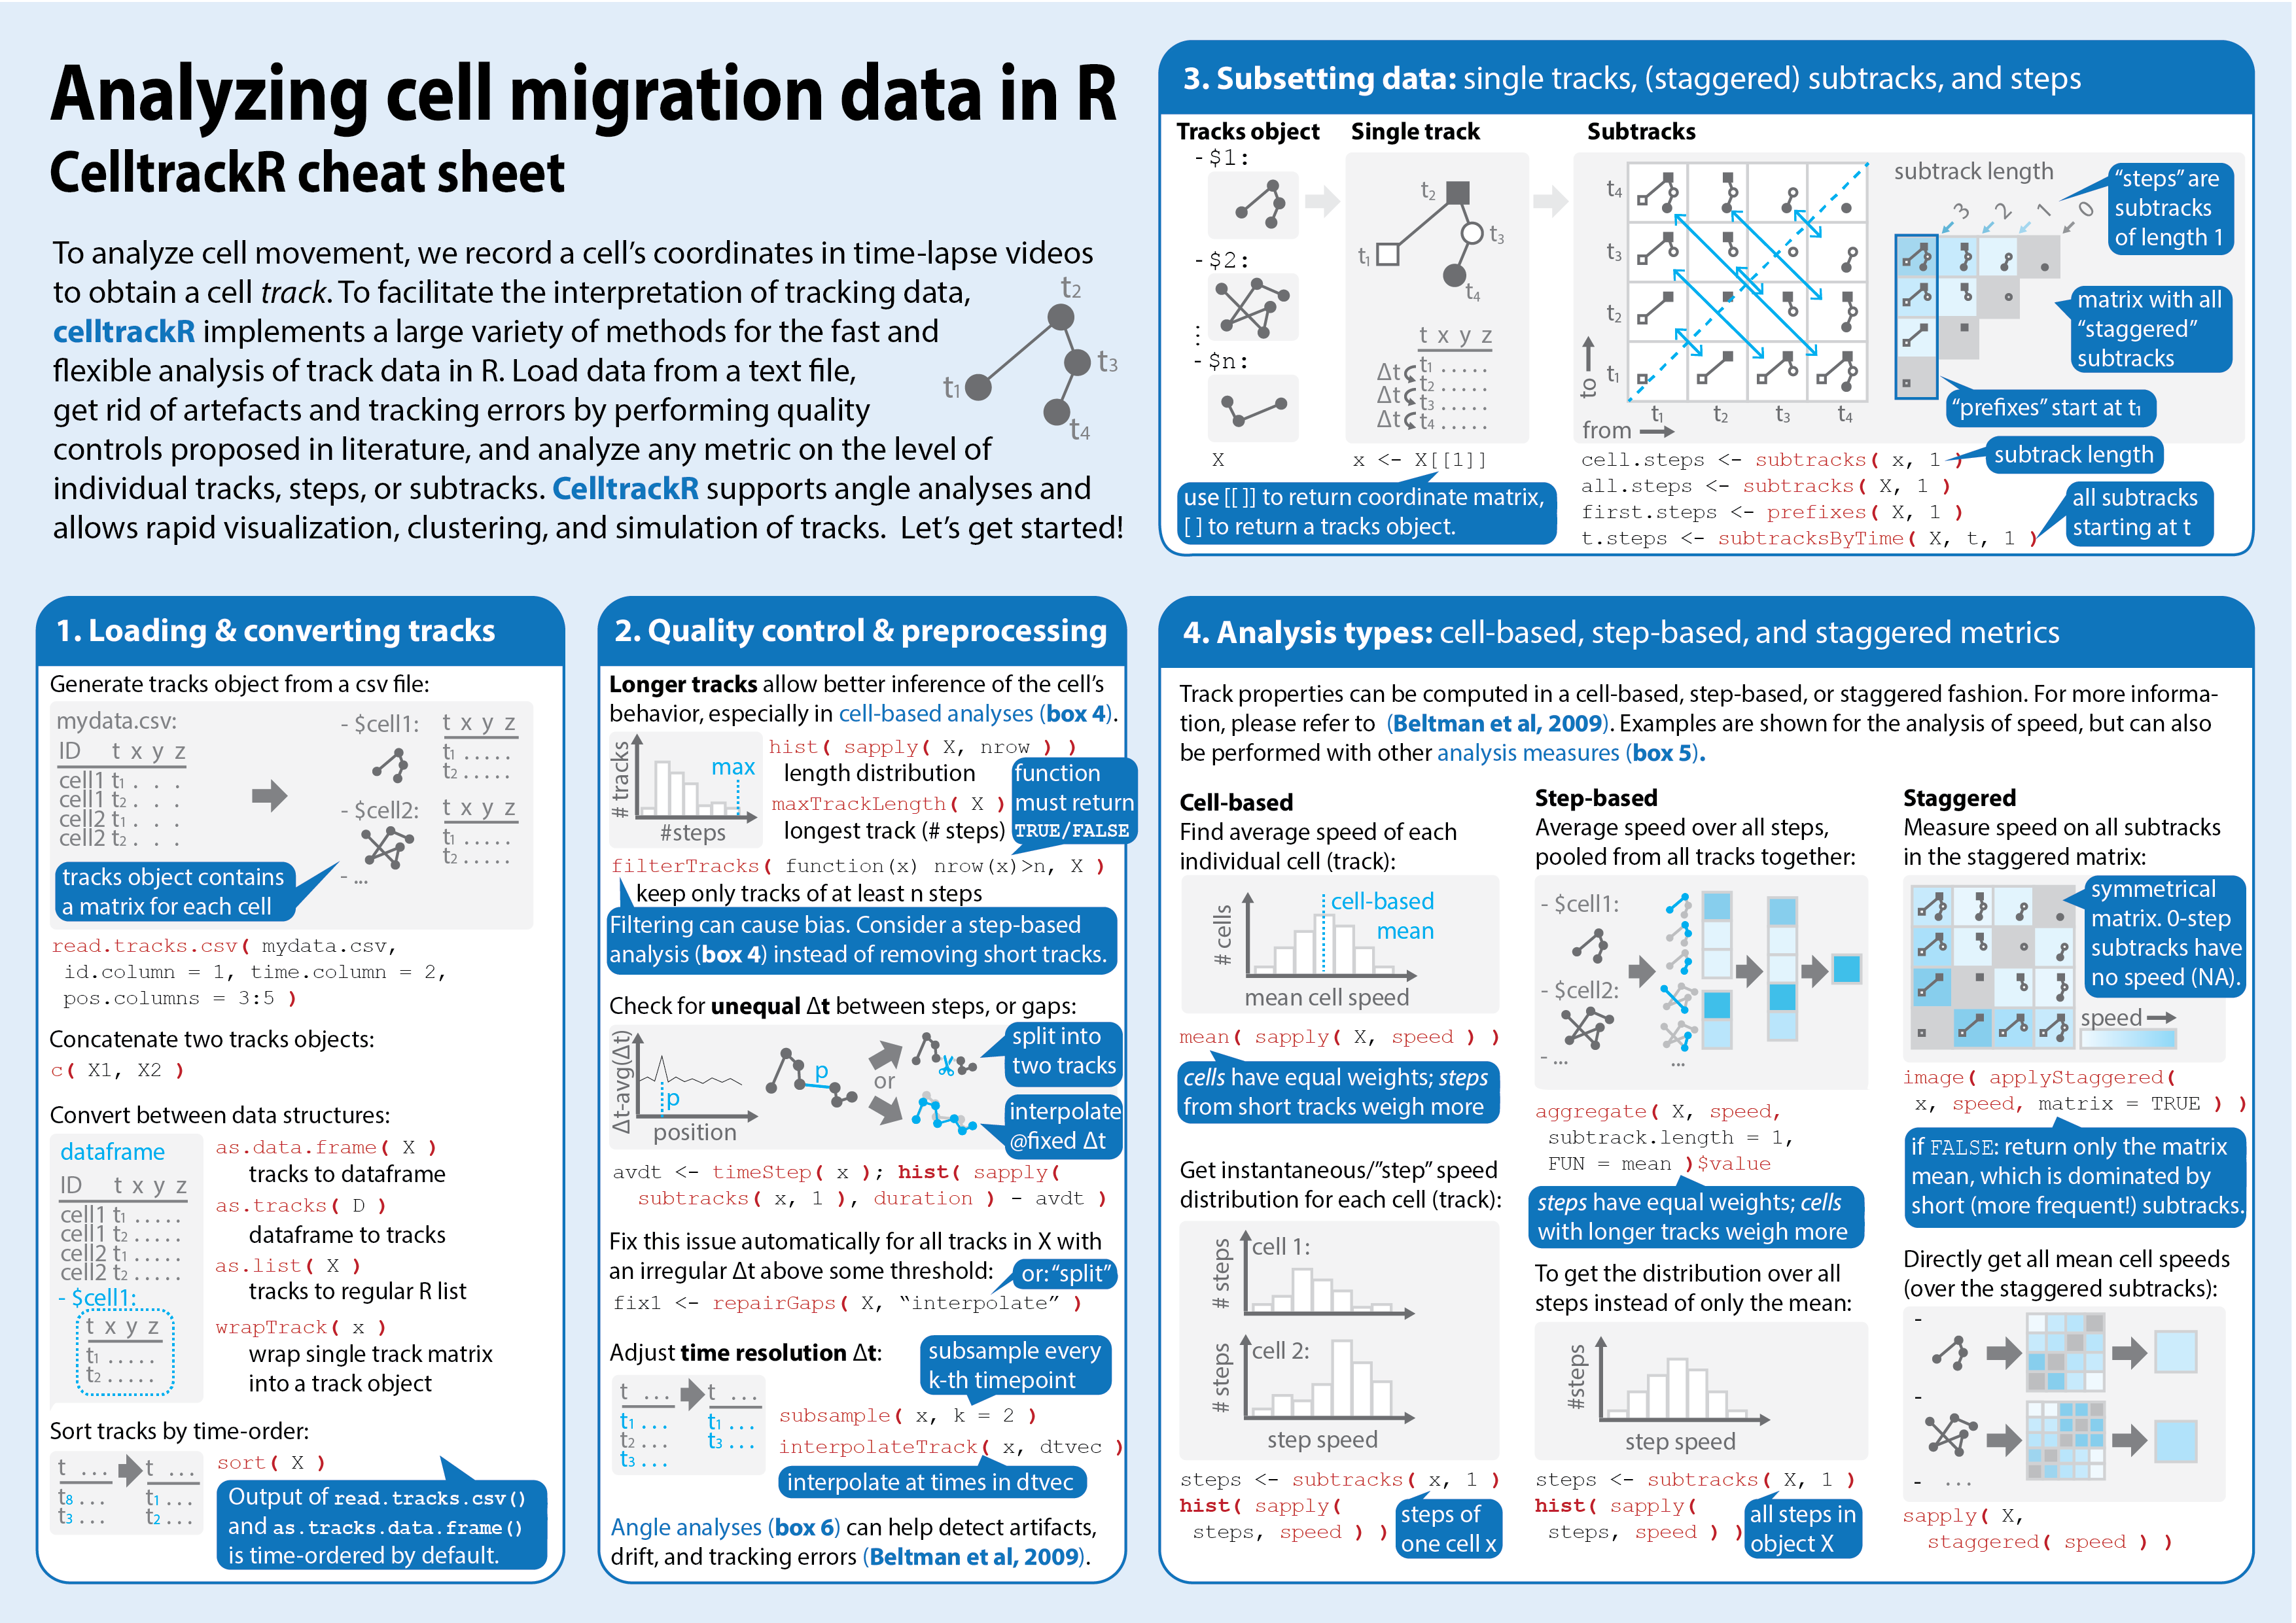
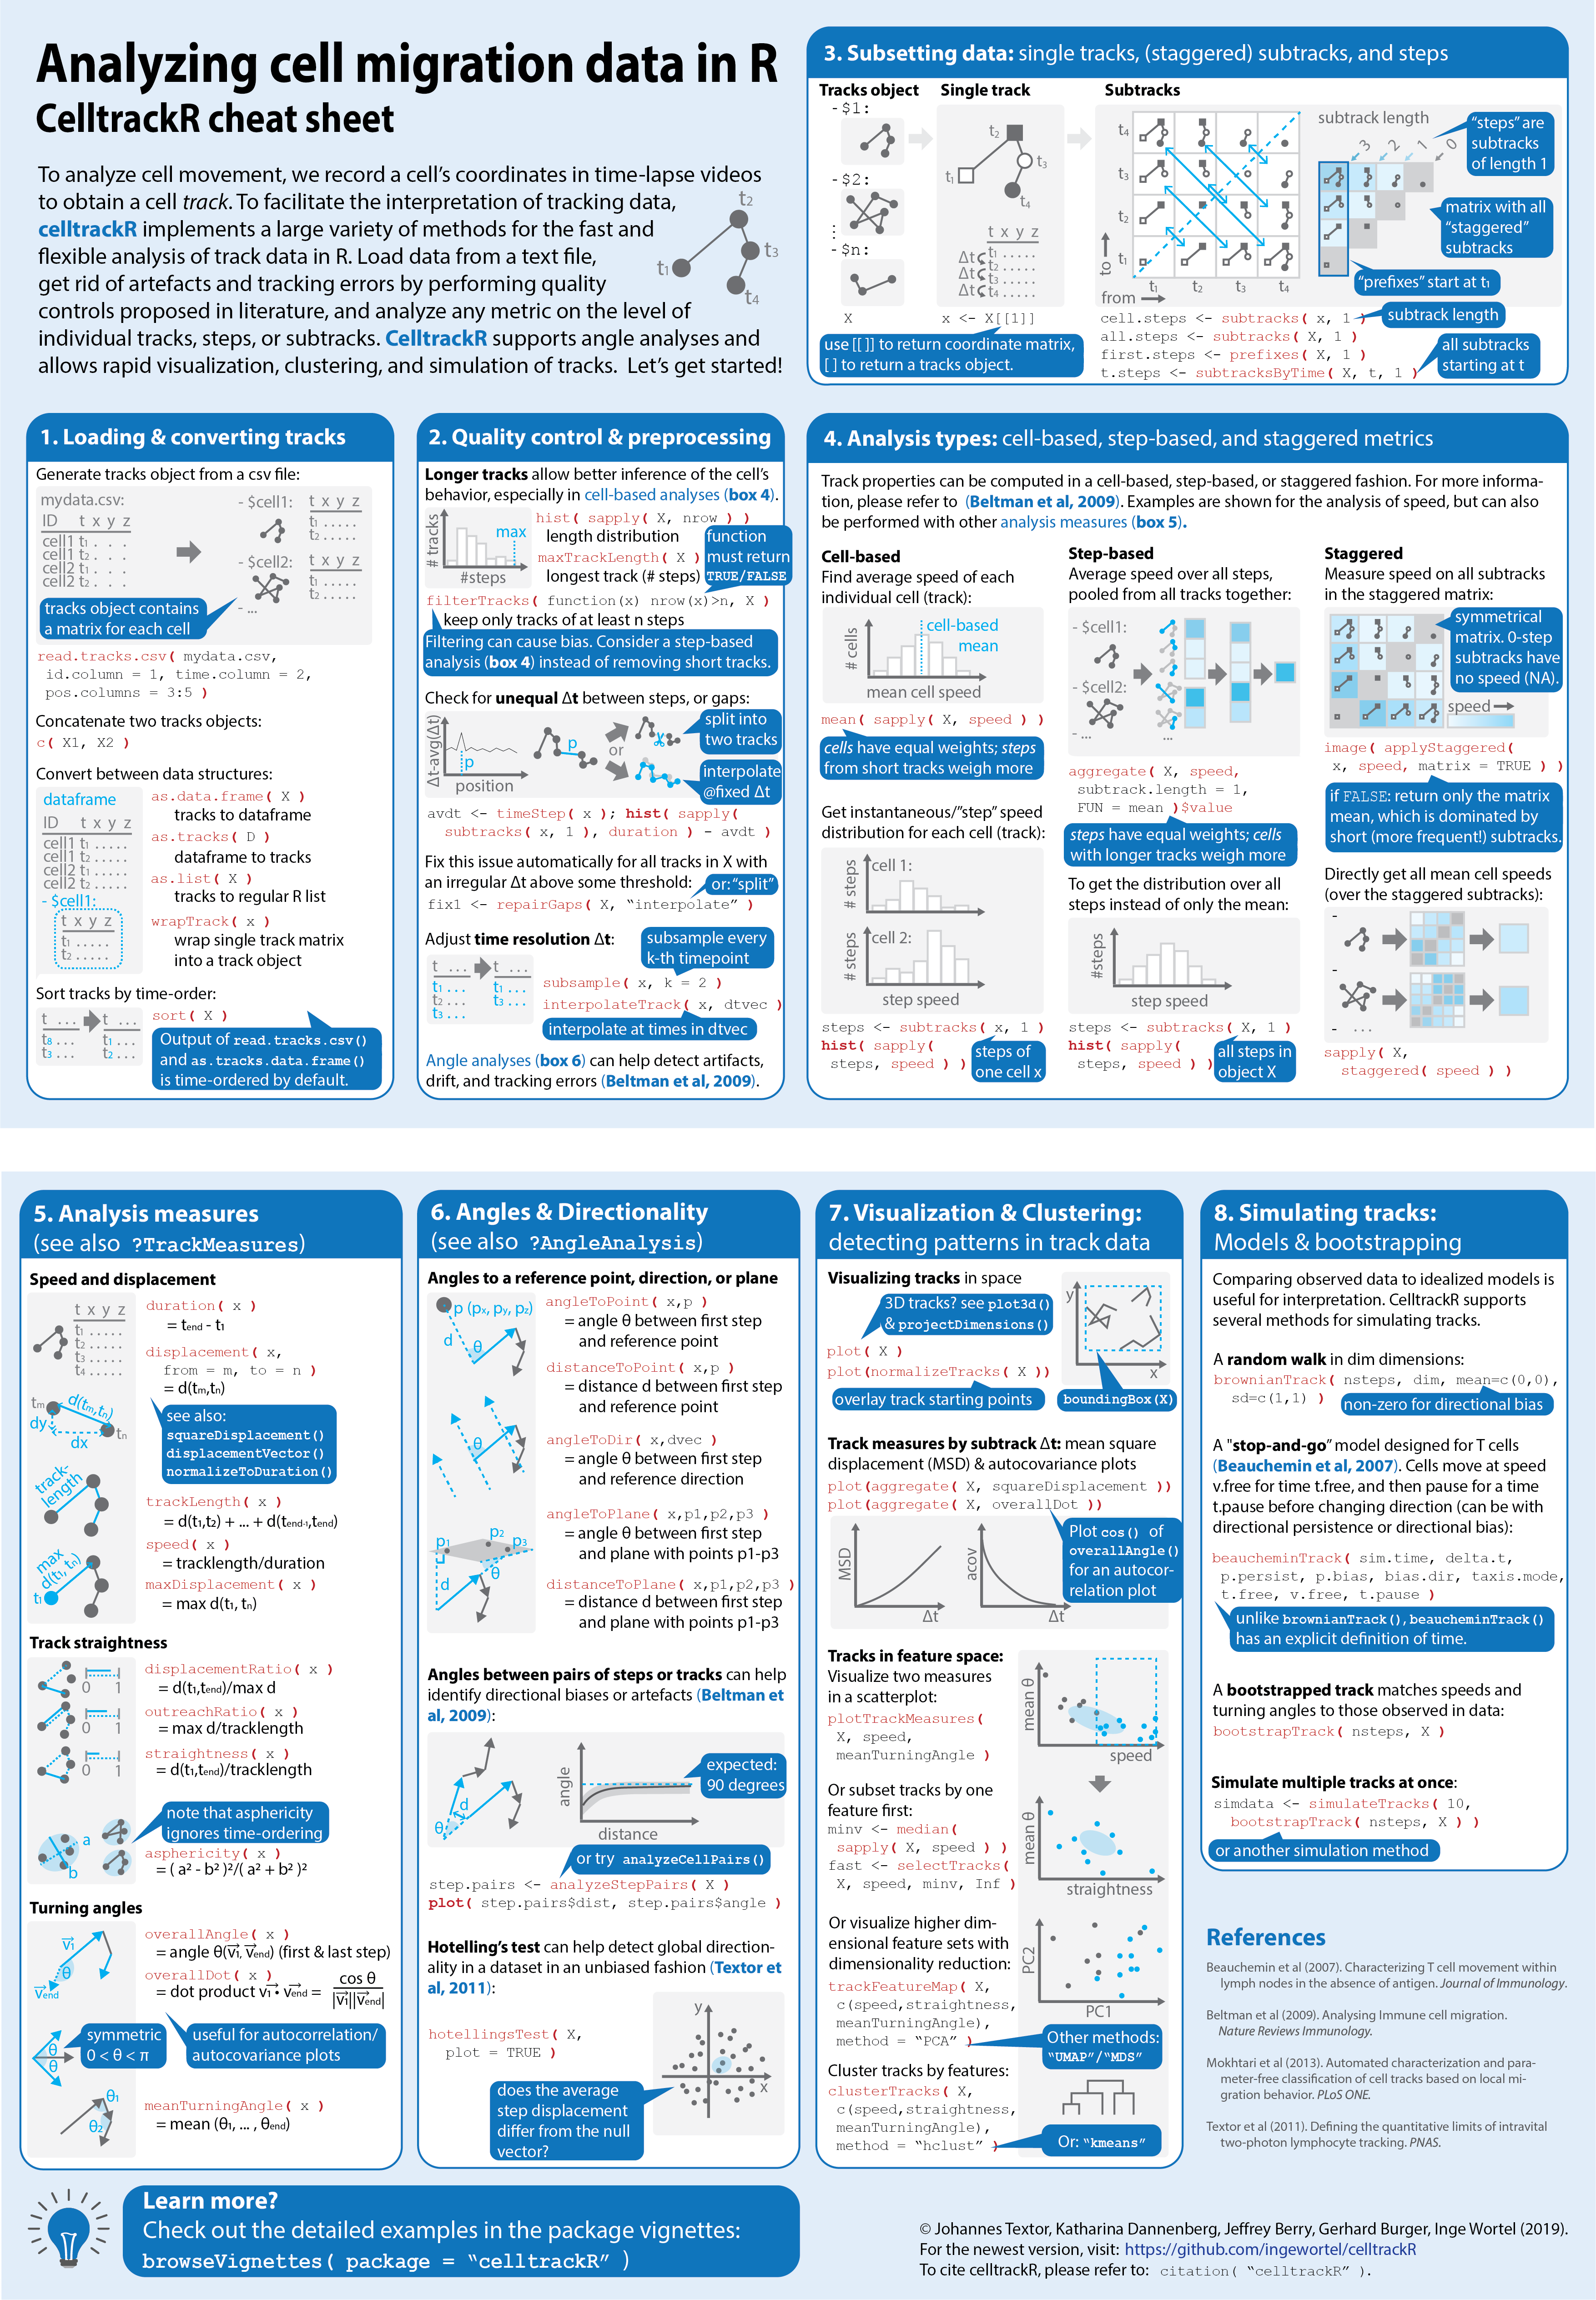
Fast forward: the end product
Step 4: Document
So now our software can do lots of stuff... Which is useless if nobody knows how!
Software documentation:
- Document each function: help pages
- Explain the analysis process: tutorials/"vignettes"

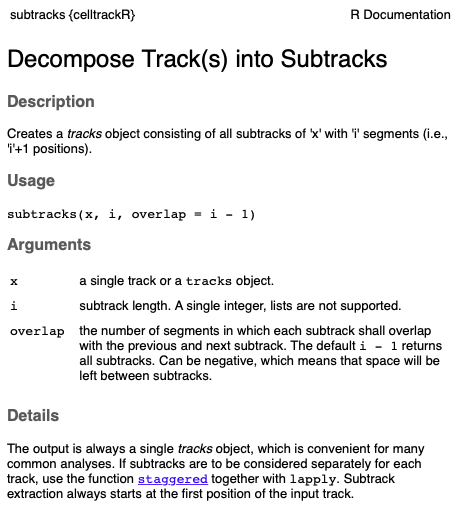
Step 4: Document
So now our software can do lots of stuff... Which is useless if nobody knows how!
Software documentation:
- Document each function: help pages
- Explain the analysis process: tutorials/"vignettes"
- Overview of functionalities: cheat sheet
$\rightarrow$ Often forgotten in scientific software...
Step 5: Release & Publish
Releasing an R package:
- Structure content so R recognizes functions & documentation
- Check that everything works
- Choose a license: who can use & adjust?
$\rightarrow$ GPL: open-source, free use & adaptation. - Upload to Github or CRAN
Step 5: Release & Publish
Publishing software:
- Some journals have a "Methods"-like format for software
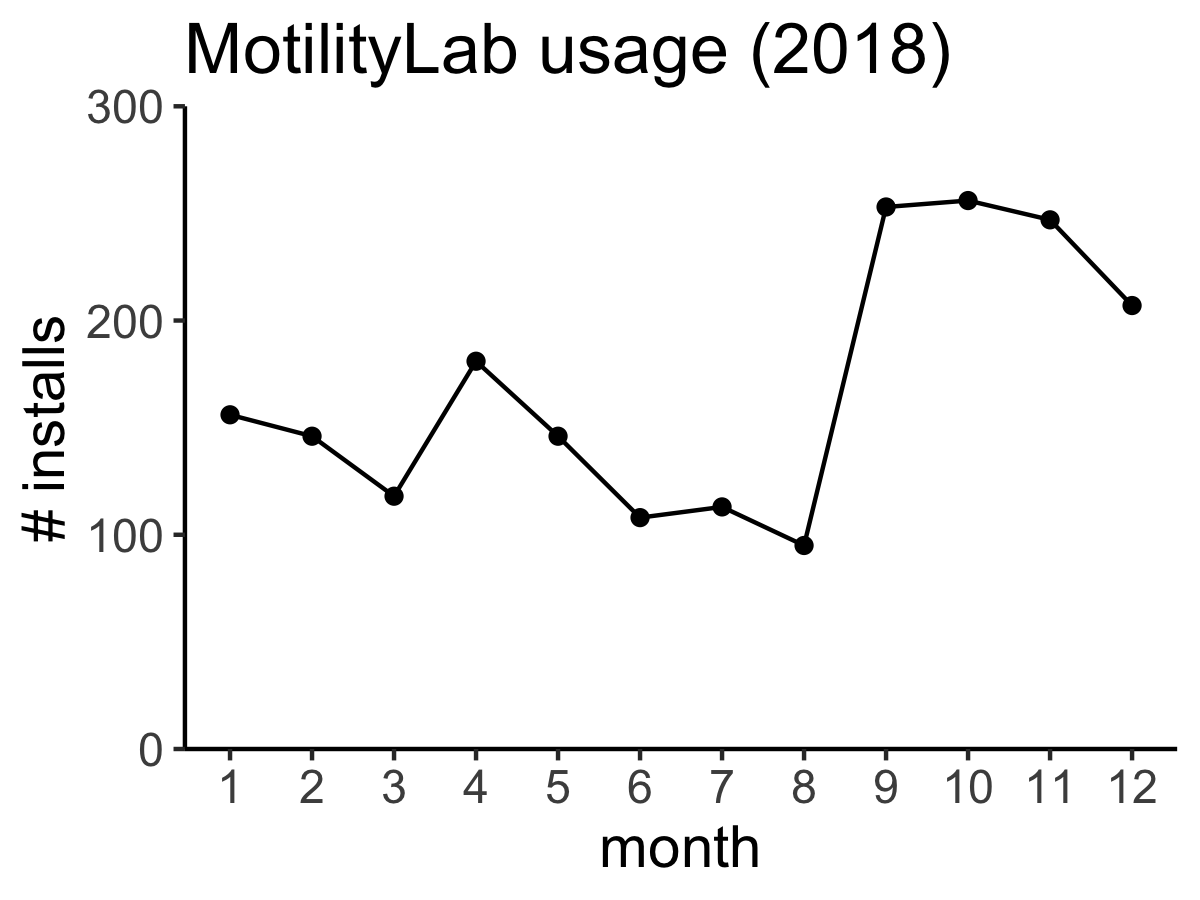
Step 6: Spread & Maintain
An earlier version of celltrackR is already being used:
Discussion
Some software is also science:
- Which you can publish;
- Which you can cite!
| |
Cellprofiler: Anne Carpenter lab (Broad Institute, MIT) |
| |
Icy: Bioimage Analysis unit (Institut Pasteur) |
| |
ImageJ: NIH |
Acknowledgements
Tumor Immunology, RIMLS
- Johannes Textor
- Jolanda de Vries
- Carl Figdor
- Human DLM
Division of Toxicology, Universiteit Leiden
- Gerhard Burger
Funding
- Radboudumc PhD grant
- NIH
Institute for Theoretical Computer Science, Lubeck university
- Katharina Dannenberg
Division of Infectious Diseases, Washington University
- Mark Miller
- Jeffrey Berry